Documentation:
The data from the gpx files can also be plotted with, for instance, matplotlib. Here are some examples:
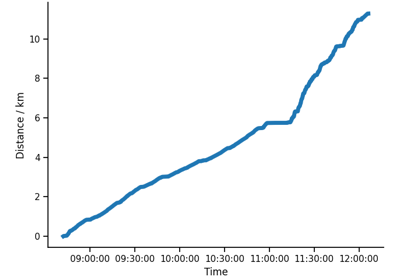
Simple plot with matplotlib
Simple plot with matplotlib (2)
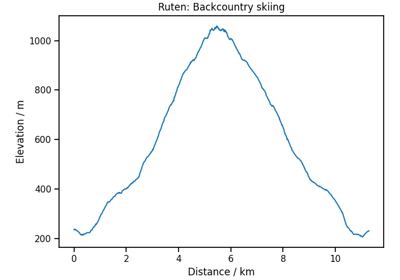
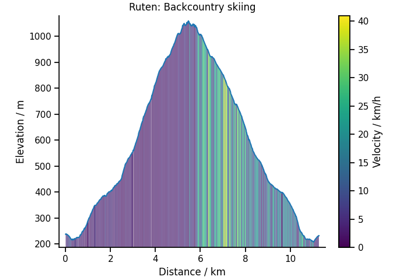
Elevation profiles - line plots
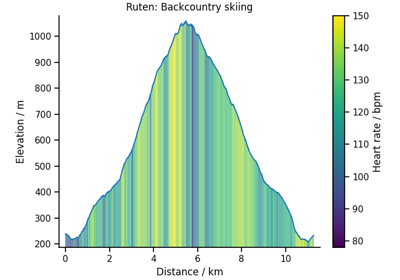
Elevation profiles - filled plots
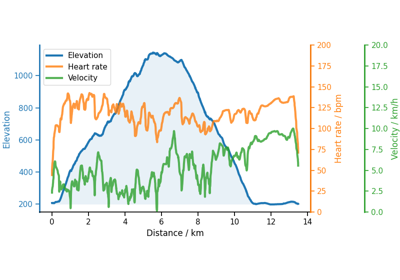
Adding velocity
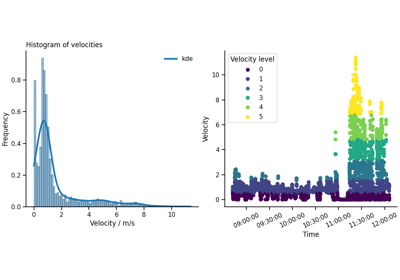
Inspecting velocities
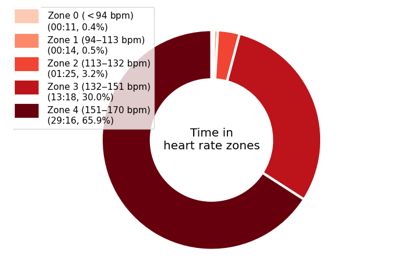
Pie chart of heart rate zones
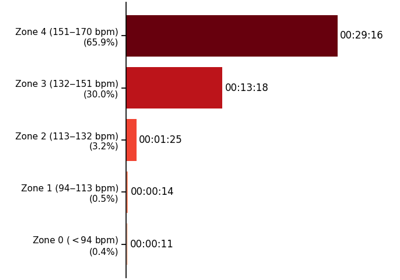
Bar chart of heart rate zones
Gallery generated by Sphinx-Gallery