Note
Go to the end to download the full example code.
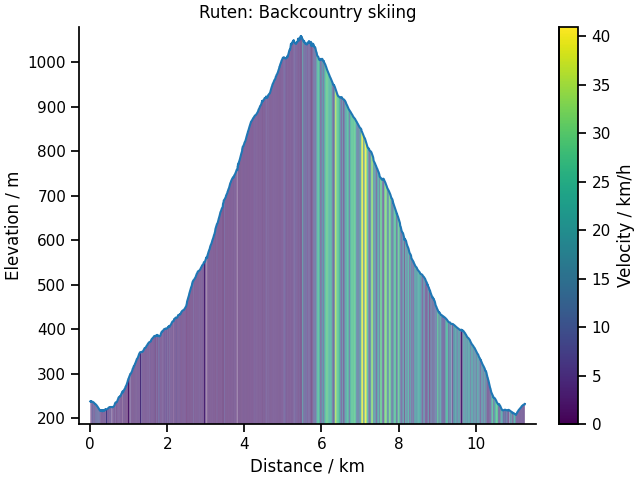
Adding velocity
This example will plot the elevation as a function of distance and color the plot according to the velocity.
Note
The velocities are calculated from the distance so it is a bit noisy.
import seaborn as sns
from matplotlib import pyplot as plt

from gpxplotter import plot_filled, read_gpx_file

sns.set_context("notebook")

for track in read_gpx_file("example1.gpx"):
    for i, segment in enumerate(track["segments"]):
        # Plot elevation as function of distance:
        fig, _ = plot_filled(
            track,
            segment,
            xvar="Distance / km",
            yvar="elevation",
            zvar="Velocity / km/h",
        )
        sns.despine(fig=fig)
plt.show()
Total running time of the script: (0 minutes 1.302 seconds)